Sarah Miller Tech

  • Home
  • Webinars
  • Blog
  • Shop
    • Shop Resources
    • eBooks
    • Shop T-Shirts
  • Free
blog image 2.png

Grab my FREE guide!

Stop neglecting social studies with these easy to use strategies! Teach social studies, even when you don’t have time!

DOWNLOAD

Graphic Organizers in Geography (that aren't maps)

September 21, 2020 by Sarah Miller
 
blog thumbnail.png
 

As you already know, teaching geography in middle school is much more than just memorizing locations on a map. Students are expected to extend their learning past the recall and identify stage in order to analyze, interpret, and predict. To accomplish this, we need much more than just maps and globes!   

Graphic organizers are a great tool to help students visualize new information. There are plenty of graphic organizers out there, but you must make sure the one you choose for your students is the best for the situation. 

read the blog post about map skills.png

For example, if students are expected to explain how population influenced agricultural and industrial locations in the United States after the Civil War, then a cause and effect graphic organizer will be best. That isn’t to say a sequencing or problem-solution organizer will not work - it just depends how you are using it and in which stage in the learning. Strategically switching the graphic organizers while covering one topic is a great way to challenge students to synthesize this new information.

Using the standard mentioned above, you might introduce the new information about how those factors influenced agricultural and industrial locations, then have students complete a cause and effect graphic organizer. The following day, you could have the students complete a problem-solution graphic organizer describing which problems those industries faced and how those problems were solved (by changing locations). Later, you might have students complete a sequencing or chronological graphic organizer that describes how the history took place (which would include the industries facing problems and solving them). 

header.png


Here’s my suggestion of graphic organizers aligned with some Georgia Standards of Excellence for middle school Social Studies: 

Standards are from Georgia Standards of Excellence (GSE)

Standards are from Georgia Standards of Excellence (GSE)

To me, having students complete a graphic organizer after learning any new information helps to solidify the new content. It can be a great way for students to process what they’ve just learned. This process can also be a great way for you to check for understanding and clear up any misconceptions. 


free graphic organizers.png

Here are some free generic graphic organizers you can use to enhance your geography lessons.

c and e2.png
p and s.png
Venn.png
web diagram.png
Slide1.png

Population Distribution

This reading activity packet features a graphic organizer to help students visualize the causes of population patterns in Southwest Asia.


resources that feature graphic organizers.png
ss5h1.2.png
ss5h5.png
ss6h3.png
ss5h2.png
ss6g2.png
ss7h3.png

 
Screen Shot 2020-05-09 at 2.28.28 PM.png
 
September 21, 2020 /Sarah Miller
geography, Social Studies

5 Days of 6th Grade FREEBIES

You’ll get exclusive access to 5 free resources that are waiting to be used in your social studies classroom. They're all standards-aligned and can be used to teach both social studies concepts and ELA skills! Can it get any better?! Don’t miss out!

DOWNLOAD NOW

Map Skills Resource Round Up for Middle School

August 10, 2020 by Sarah Miller
 
Blog Thumbnails .png
 

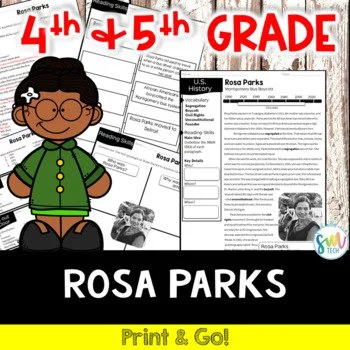
I’ve got so many resources you can use right now in your classroom for your Civil Rights Unit!

5th Grade Differentiated, CCSS-Aligned Reading Packet

Learn more

8th Grade Reading Packet, CCSS and GSE-Aligned

Learn more

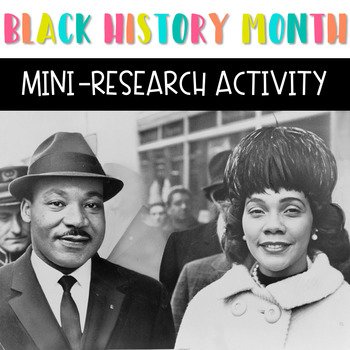
Mini-Research Activity

Learn more

2nd Grade Martin Luther King, Jr. Reading Activity Set

Learn more

5th Grade Reading Activity

Learn more

Digital Learning Set

Learn more

5th Grade Reading Packet

Learn more

Quotes Analysis Activity Set

Learn more

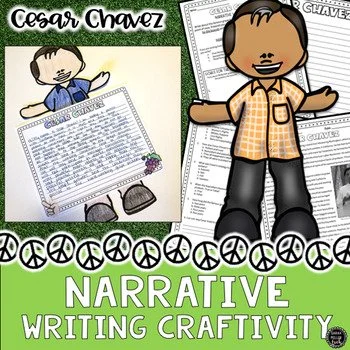
Narrative Craftivity with Cesar Chavez

Learn more

check out map skills blog post

FREE Boom Cards Set

“It’s easy to ‘save’ maps and graphs for your geography units, but maps and graphs can and should be tied into other concepts of social studies.”

Read the Blog Post


blog image 2.png

Grab my FREE guide!

Stop neglecting social studies with these easy to use strategies! Teach social studies, even when you don’t have time!

DOWNLOAD

August 10, 2020 /Sarah Miller
map, Social Studies
blog image 2.png

Grab my FREE guide!

Stop neglecting social studies with these easy to use strategies! Teach social studies, even when you don’t have time!

DOWNLOAD

Teaching Population Distribution in Europe

July 26, 2019 by Sarah Miller

Population Distribution in Europe can be so tricky to teach! 

Teaching factors that affect where people live can be difficult! One way to help your kiddos grasp it is by comparing and analyzing maps. You can display a population density map alongside a climate or distribution of natural resources map. Working with this combo can really help your students to visualize that climate and natural resources have an impact on where people live. 

Below is a climate map I found that can be really helpful. While students do not need to know the specifics in all the different types of climates listed, they should be able to visualize which climates are more unfavorable (those in the dark blue in northern Russia). They should then be able to compare this to the population distribution map, also linked below.  Students should be able to note the similarities

1200px-Europe_map_of_Köppen_climate_classification.svg.png
population map EUROPE.jpg

population in europe.jpg

Don’t have time to create your own resource?

I’ve got you covered!

Click Here!

Tips for Map Activities

Here are some prompts I like to use for discussion about population distribution while using maps.

Population Map Activity Graphic.jpg

Another tip is to use a good old graphic organizer! Below is a sample of a generic graphic organizer I like to use for population distribution.

Screen Shot 2019-09-05 at 3.56.39 PM.png
population in europe.jpg

Need an activity for Population Distribution?

I’ve got you covered!

Click Here!
July 26, 2019 /Sarah Miller
Social Studies

© Sarah Miller Tech ∙ Powered by Squarespace ∙ Privacy Policy ∙ Terms of Use ∙ Disclaimer